|
A brief introduction to DNA barcoding and intraspecific genetic variation
Focus on western Palearctic butterflies
For an organism, its genetic information is written in the molecule DNA.
DNA is the code of life or in other words, DNA contains codes in which our hereditary properties are recorded.
The molecule Deoxyribonucleic acid (DNA) is a long chain of repeating units, the nucleotides.
The nucleotides are made up of a nitrogenous base, a pentose and phosphate group(s)
Four different nitrogenous bases (Fig. 1) are present: cytosine (C), guanine (G), adenine (A) and thymine (T)
Adenine-Thymine and Cytosine-Guanine bind to each other as base pairs, by hydrogen bonds to form the typical DNA double helix (Fig. 2a)
These are the nucleotide pairs:
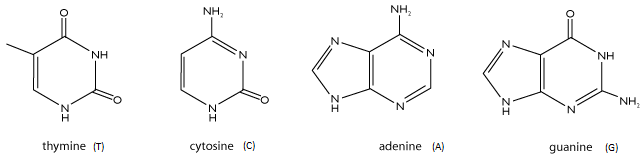
Fig. 1. 2D structure of the four nitrogenous bases (© SC)
The four nitrogenous bases (A, T, C and G) are the "language" in which the genetic code is written.
The order of these bases in the DNA molecule is the DNA sequence.
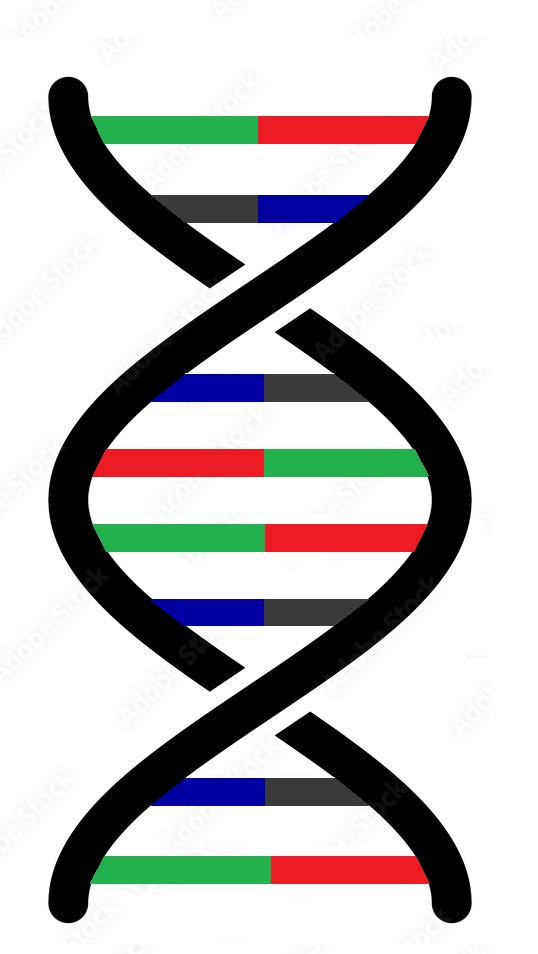 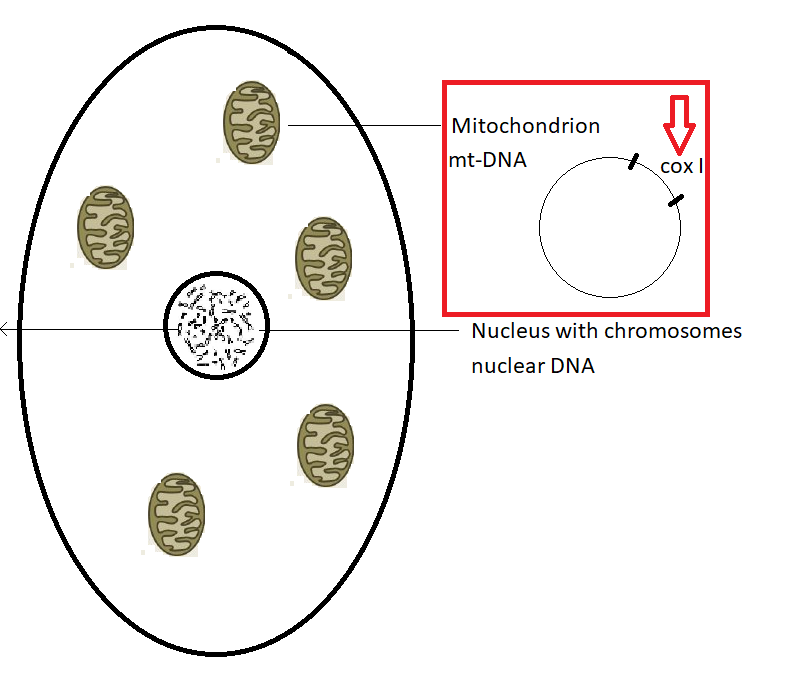
Fig. 2a. A typical DNA double helix structure (2D) in the nucleus of a cell (© SC)
Adenine (red) forms hydrogen bonds to thymine (green) and cytosine (blue) to guanine (yellow)
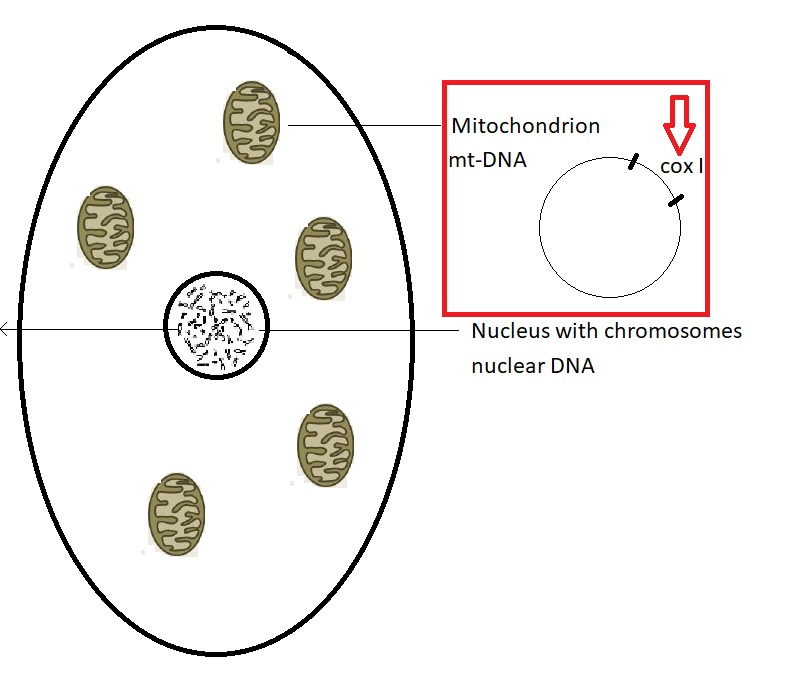
Fig. 2b. A cell with the nucleus and mitochondria. The structure of mitochondria is circular (© SC)
The target gene is cox1 (cytochrome cyclooxidase subunit 1)
DNA polymerase (an enzym) forms new copies of DNA in the form of nucleic acid molecules.
This enzym is widely used in laboratories to copy and multiply segments of DNA molecules via the polymerase chain reaction in, better known as PCR.
This is automatized in PCR machines.
Every cell (Fig. 2b) contains DNA in two places: the nucleus and the mitochondria (the powerhouse of the cell)
The DNA barcoding system uses a part of the cyclic mitochondrial DNA (mt DNA) the cytochrome cyclooxidase subunit 1 (cox1 or COI)
The mt DNA is maternally inherited and it does not always reflect the patterns observed with nuclear DNA.
At the end of the laboratory work, software programs will build the barcode of the studied specimen (Fig. 3)
The colour of the nucleotides is identical as above.
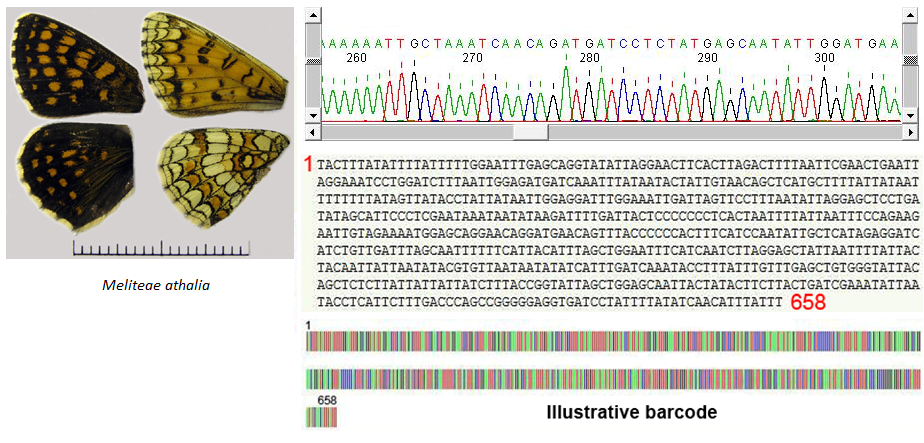
Fig. 3. From signal to illustrative barcode of a Melitaea athalia specimen (© Vlad Dinca)
When the DNA sequences of different specimens are available, it is possible to compare the barcodes visually and this is automatized by software programs.
In Fig. 4 the barcodes of two putative Polyommatus (Agrodiaetus) ripartii can be compared and visual analysis shows 4 differences (Fig. 5).
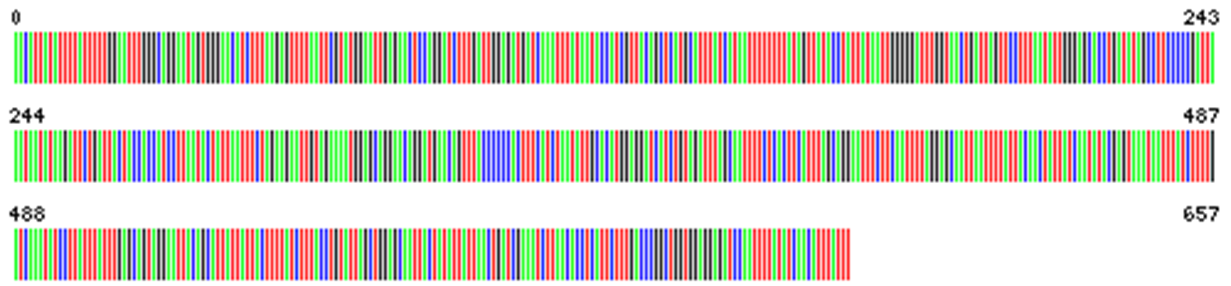 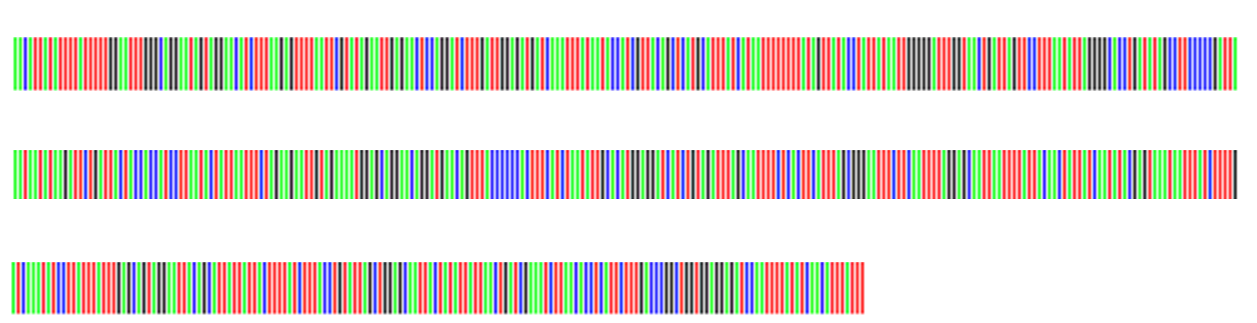
Fig 4. Barcode specimen 1 (left), barcode specimen 2 (right) (© SC)
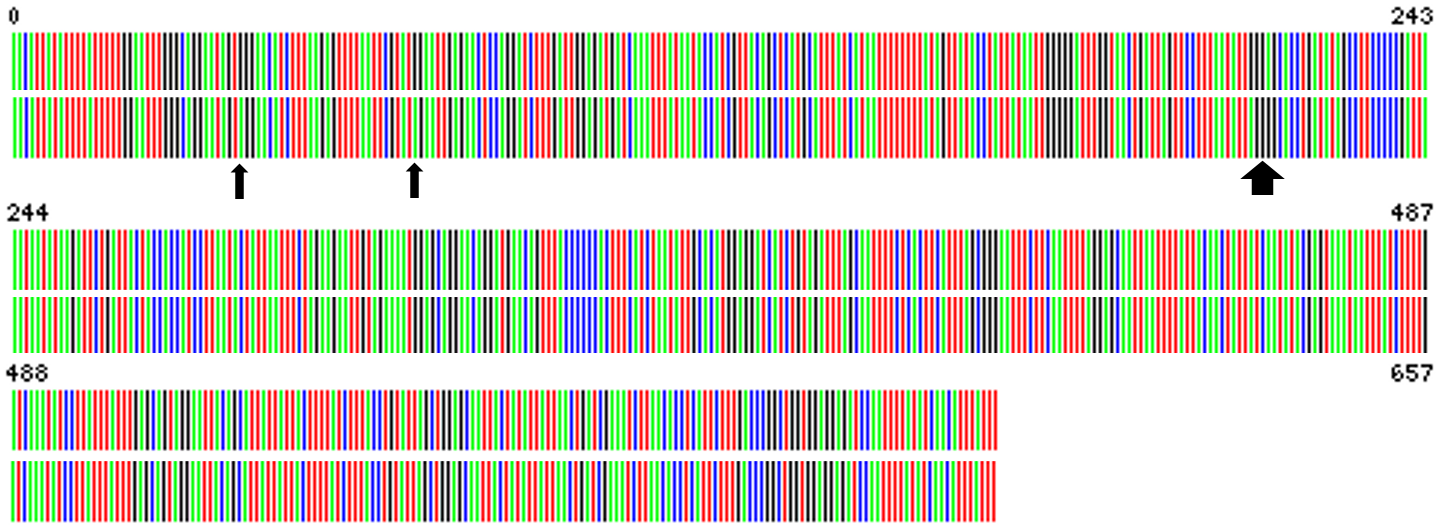
Fig. 5. Comparison of the two barcodes showing (arrows) 4 mutations (© SC)
There are four differences (mutations) on 657 nucleotides or 0.61%.
This is how the max. p-distances are calculated for a set of barcodes of a specific taxon.
The barcodes are stored in reference databases.
The Barcode of Life DataSystems (BOLD) and GenBank are the main public repositories of DNA barcode sequences.
These reference repositories can be used for taxonomic identification and are linked to voucher specimens from research institutes, musea and reference collections.
In BOLD there is a module that registers BIN's (barcode index number) for putative species.
The main studies for the European butterflies based on DNA barcoding are open source publications: Dinca et al. (2021) and Dapporto et al. (2022)
DNA barcoding has thus become an important tool for species identification but it is not the magic bullet that can solve all the questions.
Dinca et al. 2021 (Supplementary Data), identified 29 cases of barcode sharing, involving 69 species (15% of the European butterfly fauna)
Further taxonomic research is probably needed in two thirds of these cases.
DNA barcoding can speed up biodiversity research: identification of significant lineages or ESU's (Evolutionary Significant Unit) and cryptic diversity.
Delineating important ESU's and cryptic diversity is important when considering conservation actions.
Dapporto et al. 2022 (publication and Atlas) gathered an even larger dataset of DNA barcodes for the western Palearctic butterflies (including mostly new sequences for the Maghreb and Maceronesia) to generate an intraspecific genetic variation (IGV) atlas.
The checklist used is based on a revision of Wiemers et al. (2018) and Middleton-Welling et al. (2020)
Different indices for the genetic variation were computed.
Haplotype networks were calculated and constructed with colours identical to those that can be found in the haplotype distribution maps.
The maps of haplotype distribution with the coloured pie charts were generated for all sequenced specimens.
The mean number of haploytpes per species was ~16.2. There are few common haplotypes and many rare ones.
In the introduction of the atlas, the graphs (a selection in Fig. 6a-c) are explained in detail using as example the species, Brenthis daphne.
The atlas provides a summary of these graphs for each species.
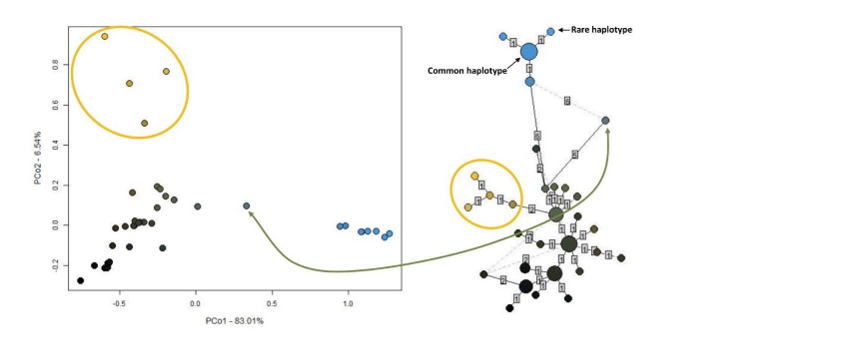
Fig. 6a. The PCoA analysis (left) for Brenthis hecate (url)
The colours are attributed according to their p-distances in the RGB space.
The haplotype network (right). Small dots represent rare haplotypes and larger dots common haplotypes.
The numbers in the small squares, show the difference in mutations between the dots.
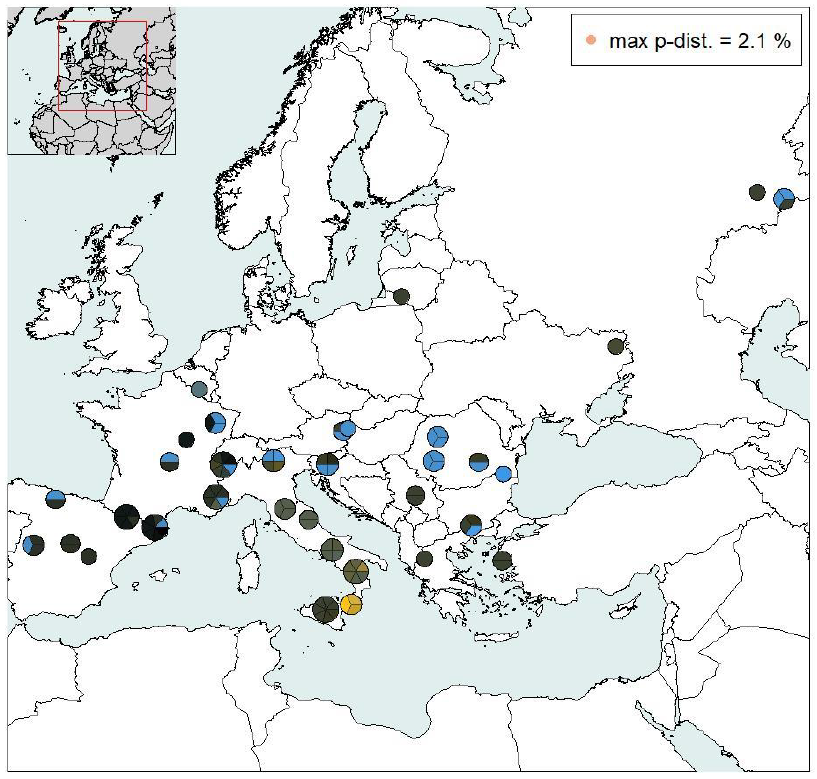 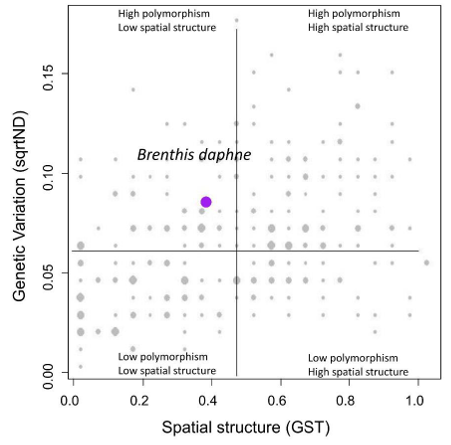
Fig. 6b. The DNA barcodes of all sequenced Brenthis daphne are plotted on the map, coloured according to the PCoA analysis (url)
They are grouped in pie charts and each pie chart shows the number of specimens barcoded and the IGV for a given locality.
The distribution of the haplotypes and groups becomes evident.
Fig. 6c. Graph showing on the y-axis the degree of nucleotide diversity (the average divergence among the sequences) and on the x-axis the standard spatial structure (how much different haplotypes are segregated in different areas) (url)
The purple dot represents Brenthis daphne, the grey bubble dots are the values for all species.
The maps show a variety of patterns.
There are species with strong divergence between the studied areas (Maghreb, Europe and the Middle East) and between the glacial refugia in southern Europe.
Included in the atlas (url) are also three tables:
1/
the new checklist for the western Palearctic butterflies.
2/
the commented list with proposed changes to the previous checklists (Wiemers et al. 2018 and Middleton-Welling et al. 2020)
3/ an updated list (from Dinca et al. 2021) with cases of barcode sharing. It now concerns 30 cases and involves 74 species.
Contact
|
 xx
xx xx
xx